 - OBDAI")
Short answer: The PRO web dashboard at dashboard.obdai.app gives you browser-based access to your scan sessions, vehicle profiles, AI-generated reports, and vehicle intelligence data — all from your desk.
Navigation
The sidebar runs down the left side. Five sections plus your profile:
- Dashboard — Home screen with stats and recent activity
- Sessions — Full scan history with search and filters
- Vehicles — All scanned vehicles with profiles
- Reports — Saved AI-generated PDF reports
- Settings — Shop profile and branding setup
Your user profile sits at the bottom of the sidebar with a Sign Out button.
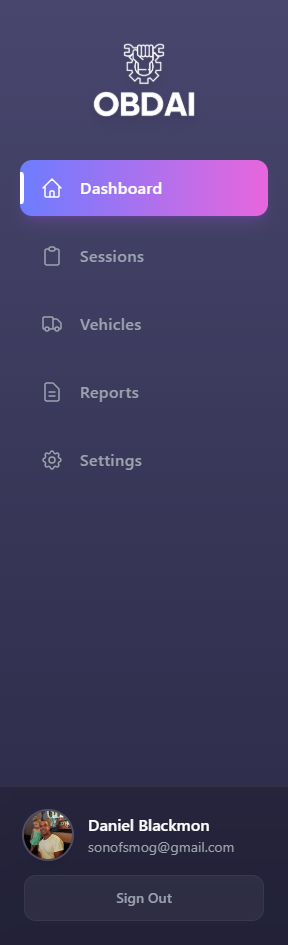 The sidebar with Dashboard, Sessions, Vehicles, Reports, and Settings
Dashboard
The main page you land on after login.
- Welcome message with your email
- Three stat cards: Total Sessions, Vehicles, Saved Reports
- Sessions Per Day bar chart with gradient purple/pink bars
- Recent Sessions table showing Vehicle, Start Time, End Time, Duration, DTCs, and Report status
- Subscription card showing “OBDAI PRO,” expiration date, and an “Active” badge
Click any session row to jump to its details.
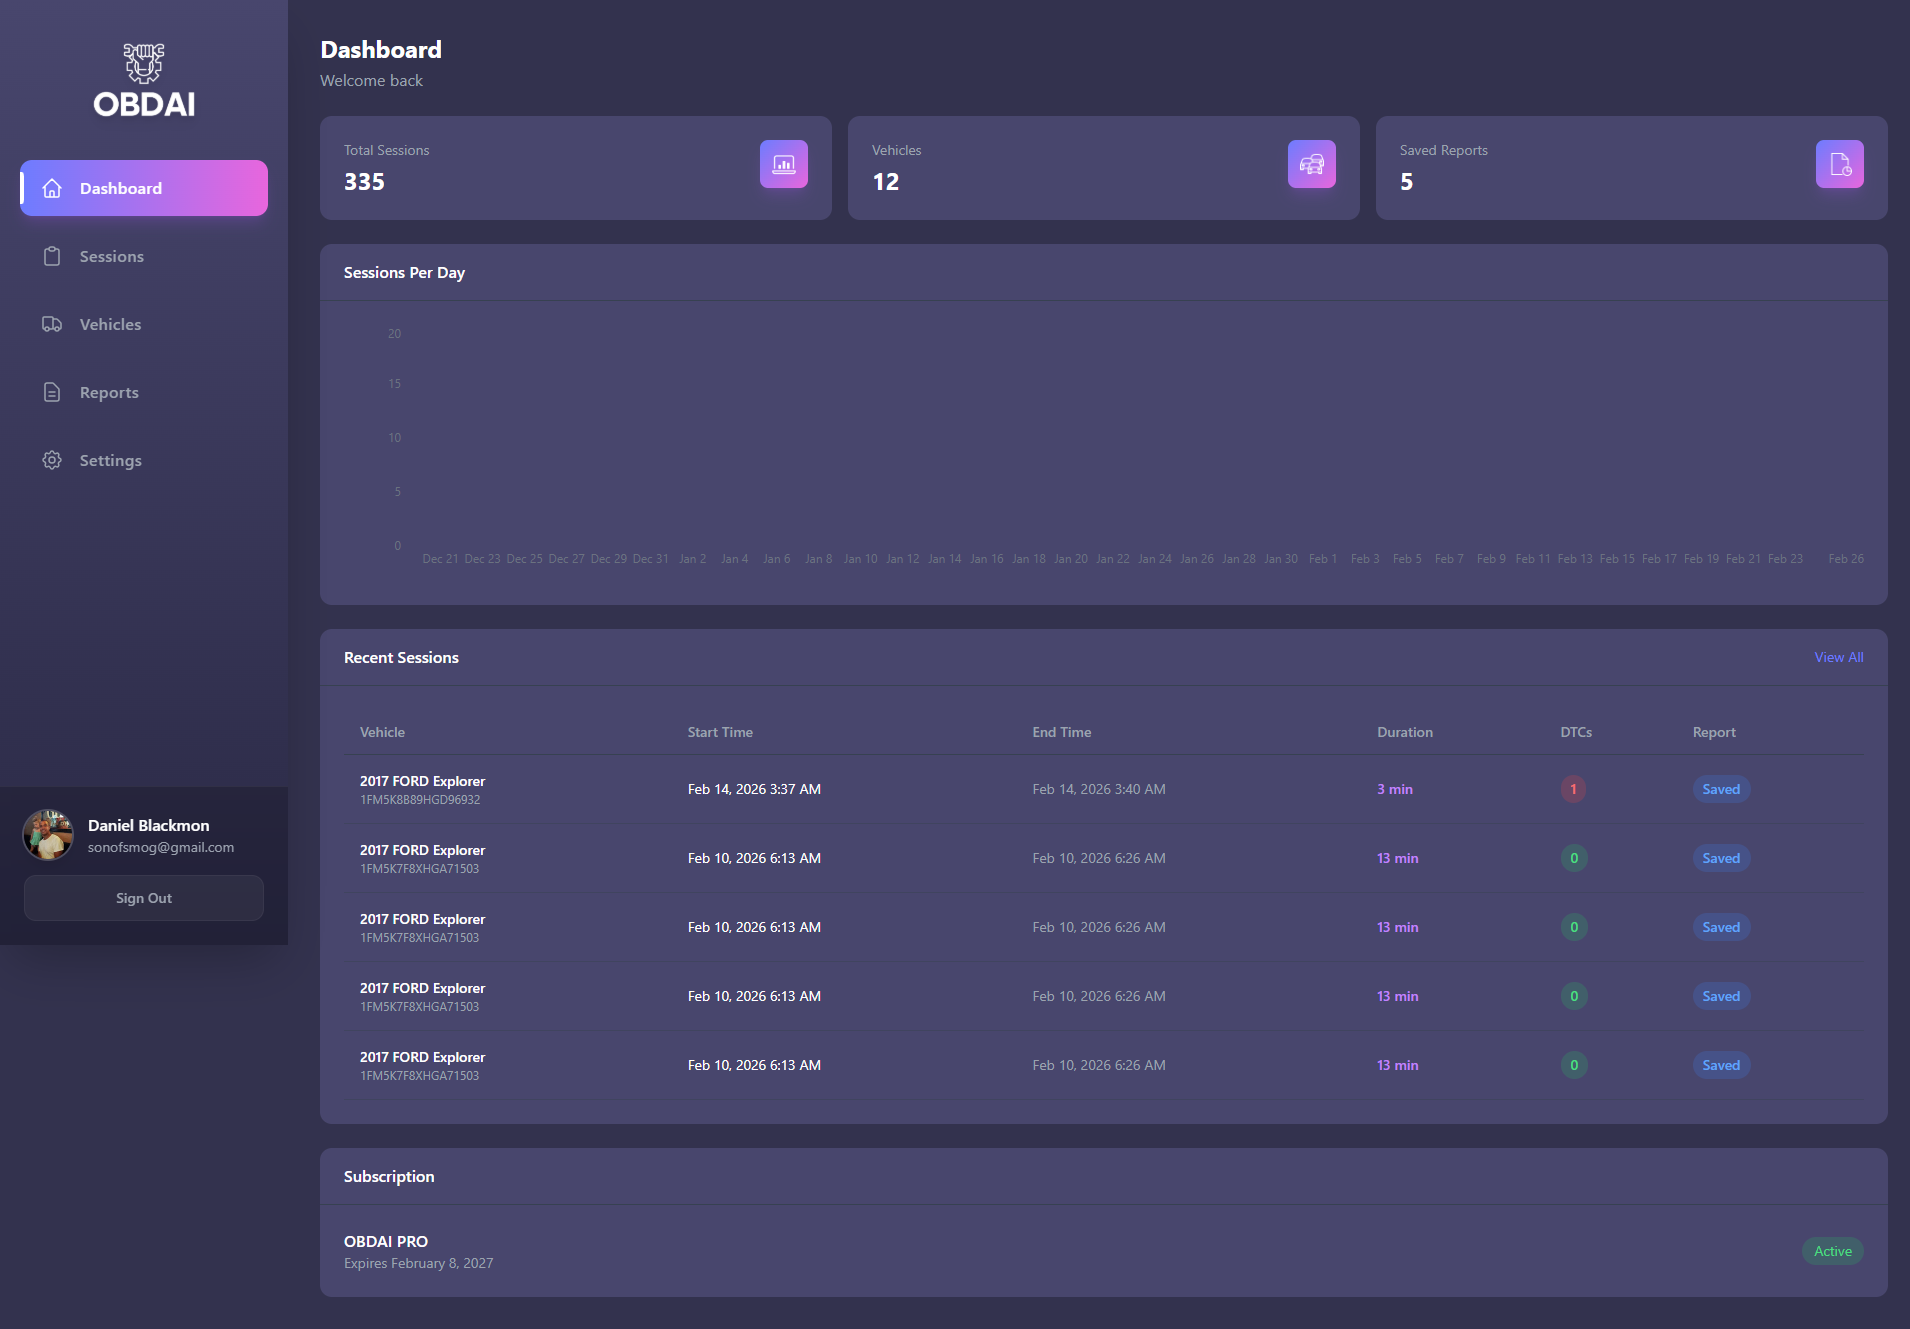 The main dashboard with stat cards, sessions chart, and recent sessions
Sessions
Title: “Scan Sessions” — browse your diagnostic scan history.
Search and filters:
- Search bar: search by vehicle name or VIN
- Vehicle dropdown filter
- Date range: start and end date pickers
- Duration buckets: All, >= 1m, < 1m, 1m-5m, > 5m
- Status filter: All Sessions, Brief Sessions, Full Sessions
- Reset Filters button
Default view: last 30 days, sessions one minute or longer.
Table columns: Vehicle (name + VIN), Start Time, End Time, Duration (tagged “Brief” or “Incomplete” where applicable), DTCs (count), Report (“Saved” badge or dash).
Result count shows “Showing X – Y of Z sessions” with pagination for large lists.
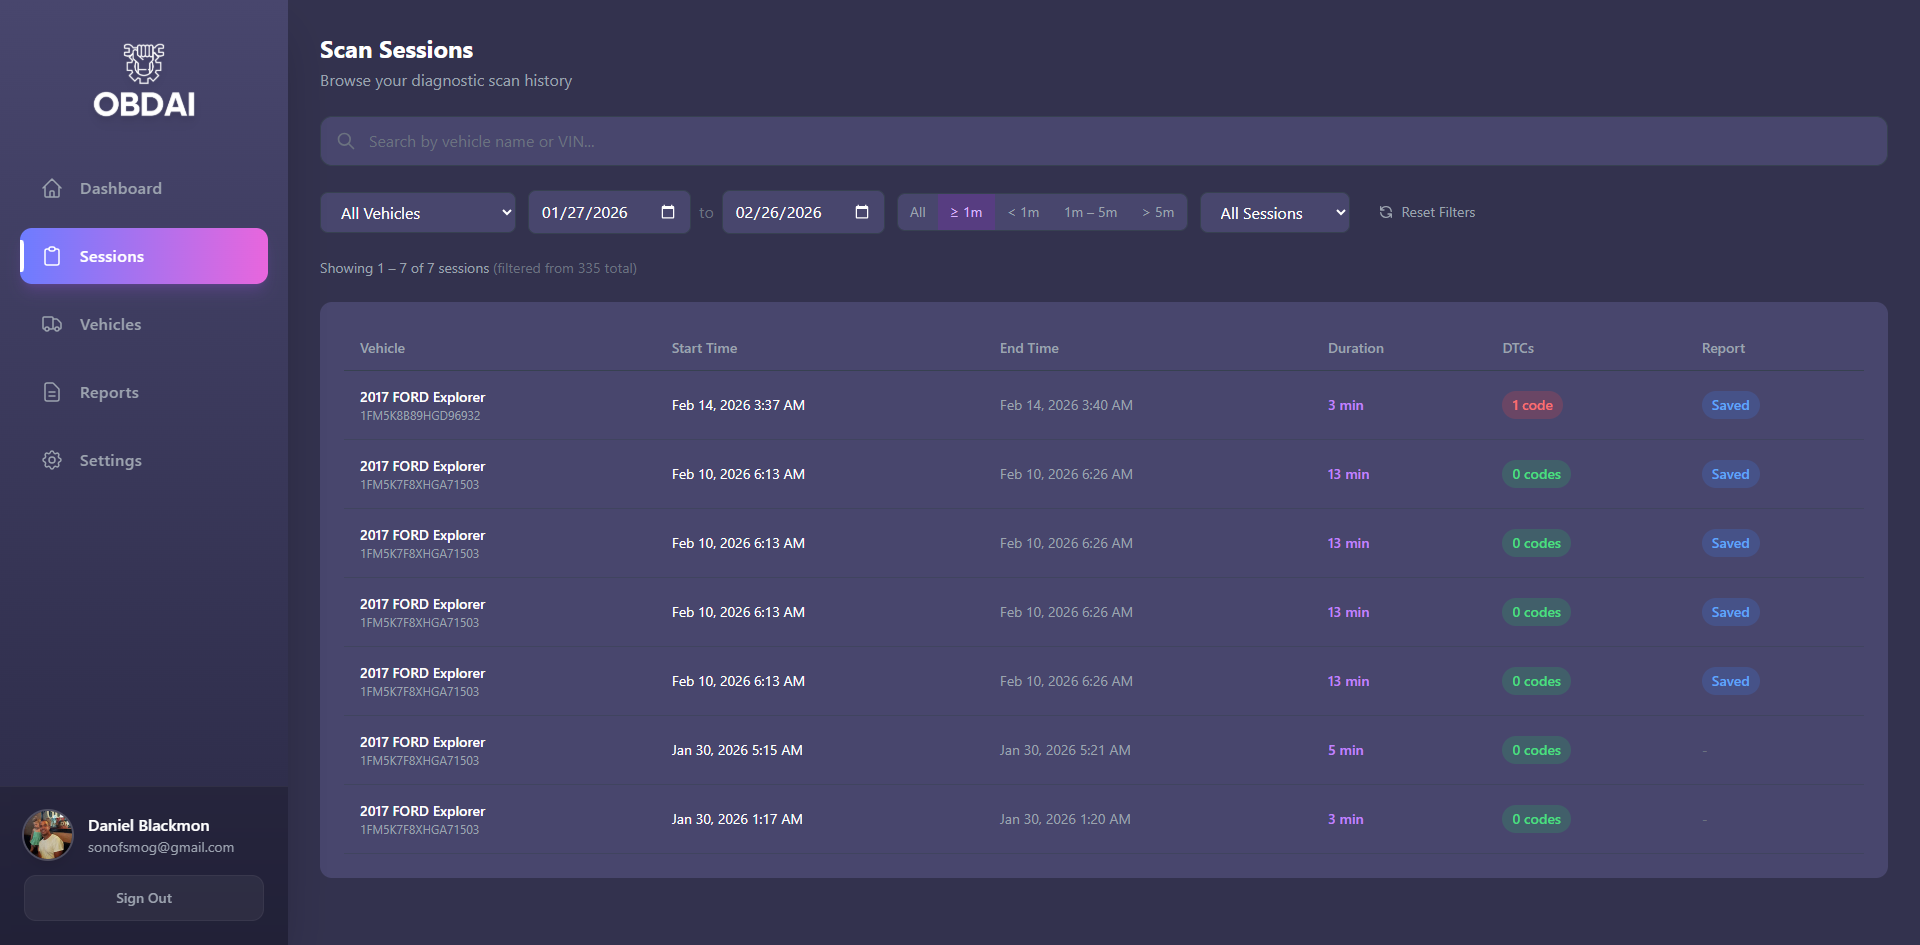 Sessions page with search, filters, and session list
Vehicles
Title: “Vehicle Profiles.”
Summary stats: Total Vehicles, Total Sessions, Total Reports, Avg Sessions/Vehicle.
Search bar and sort controls: Last Scan, Sessions, or First Scan.
Table columns: Image, Vehicle (name + VIN), Sessions count, Reports count, Last Scan date, First Scan date.
Click any vehicle to open its full profile.
Vehicle Detail
The deep-dive page for a single vehicle.
Header: Vehicle photo, year/make/model, VIN, and a compact NHTSA summary line.
Stat cards: Total Scans, Unique DTCs, Total DTC Events, Avg DTCs/Scan.
Vehicle Information card (NHTSA VIN decode):
- Vehicle: Year, Make, Model, Trim, Series, Body Type, Doors, Vehicle Type
- Engine & Powertrain: Engine, Cylinders, Displacement, Horsepower, Transmission, Drivetrain, Fuel Type
- Manufacturer: Manufacturer, Plant City, Plant Country
ARIA Diagnostic Summary with four report type buttons — Emissions (green), Diagnostic (blue), Pre-Purchase (orange), Estimate (purple).
Seven PRO Vehicle Intelligence Tabs — Market Value, Title Check, Auction, Warranty, Maintenance, Repairs, Sales History. Each tab has a PRO badge.
Charts: DTC Trend Over Time (line chart), Most Frequent DTCs (bar chart).
Recent Scans cards with DTC and MIL status badges.
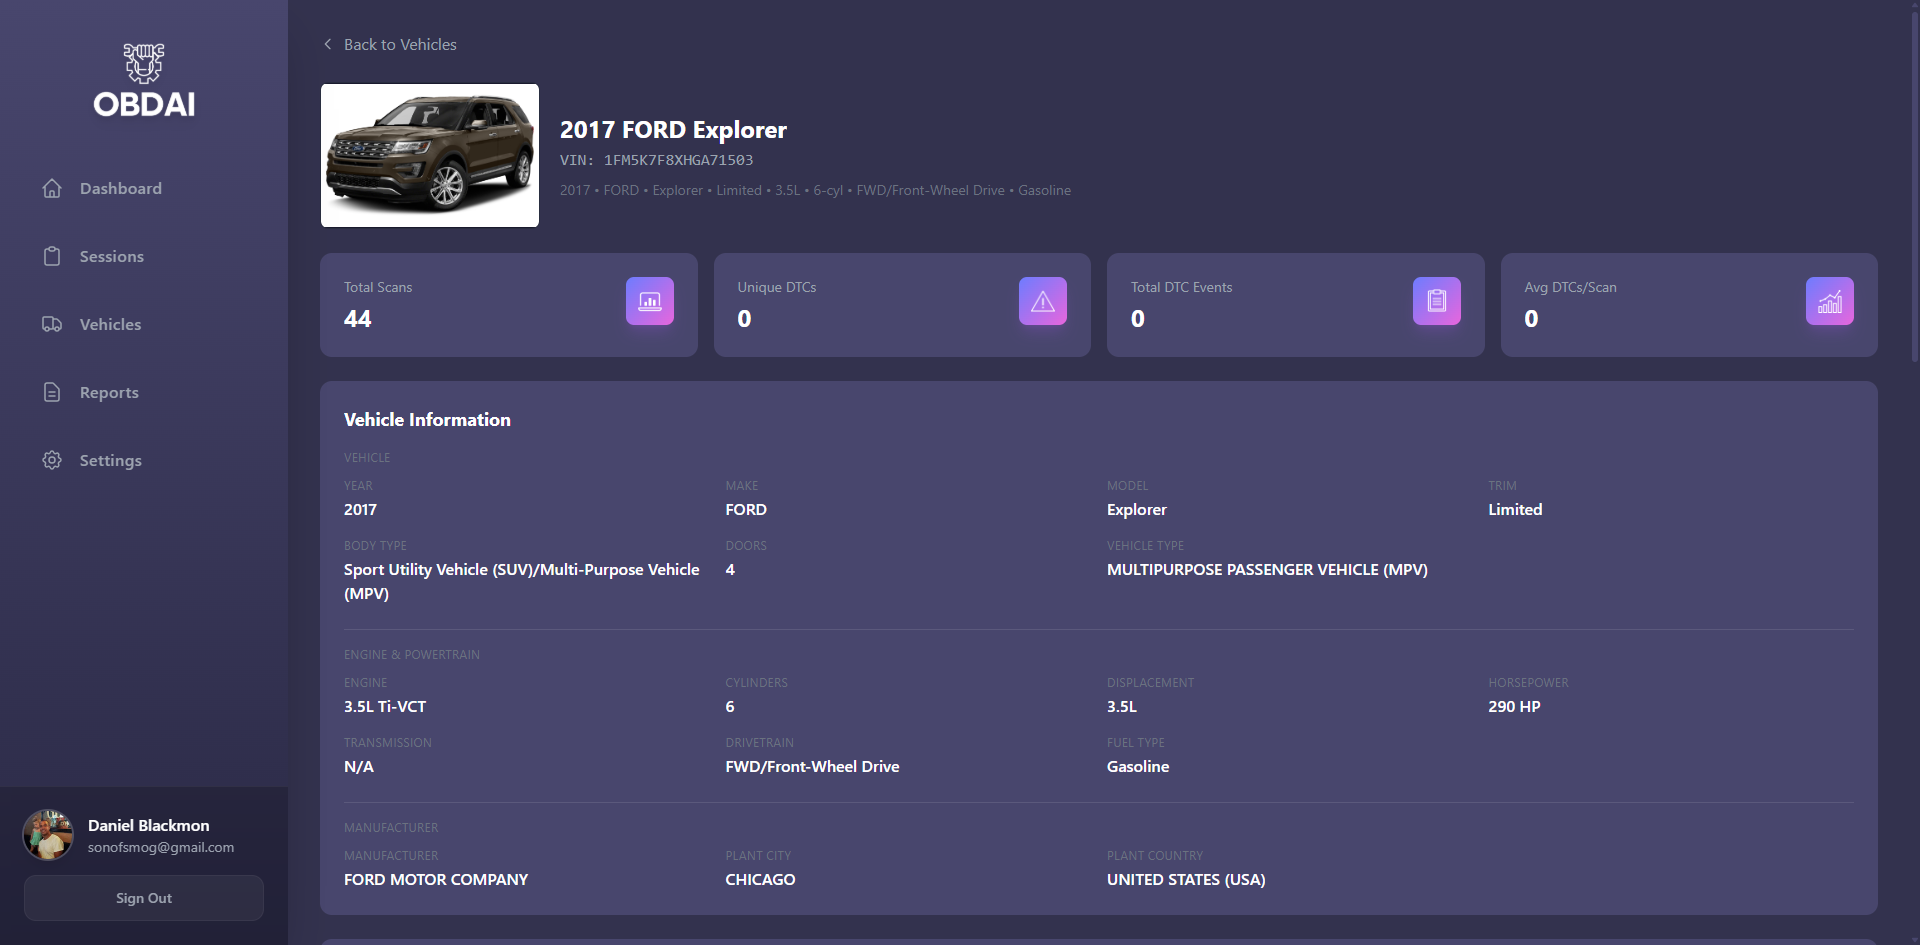 Vehicle profile showing NHTSA decode, stat cards, and AI summary
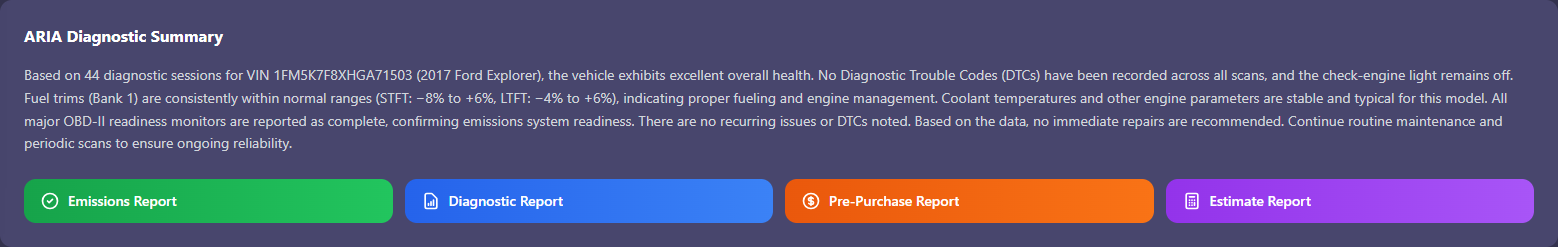 The ARIA summary section with Emissions, Diagnostic, Pre-Purchase, and Estimate report buttons
 The 7 vehicle data tabs, each with a PRO badge
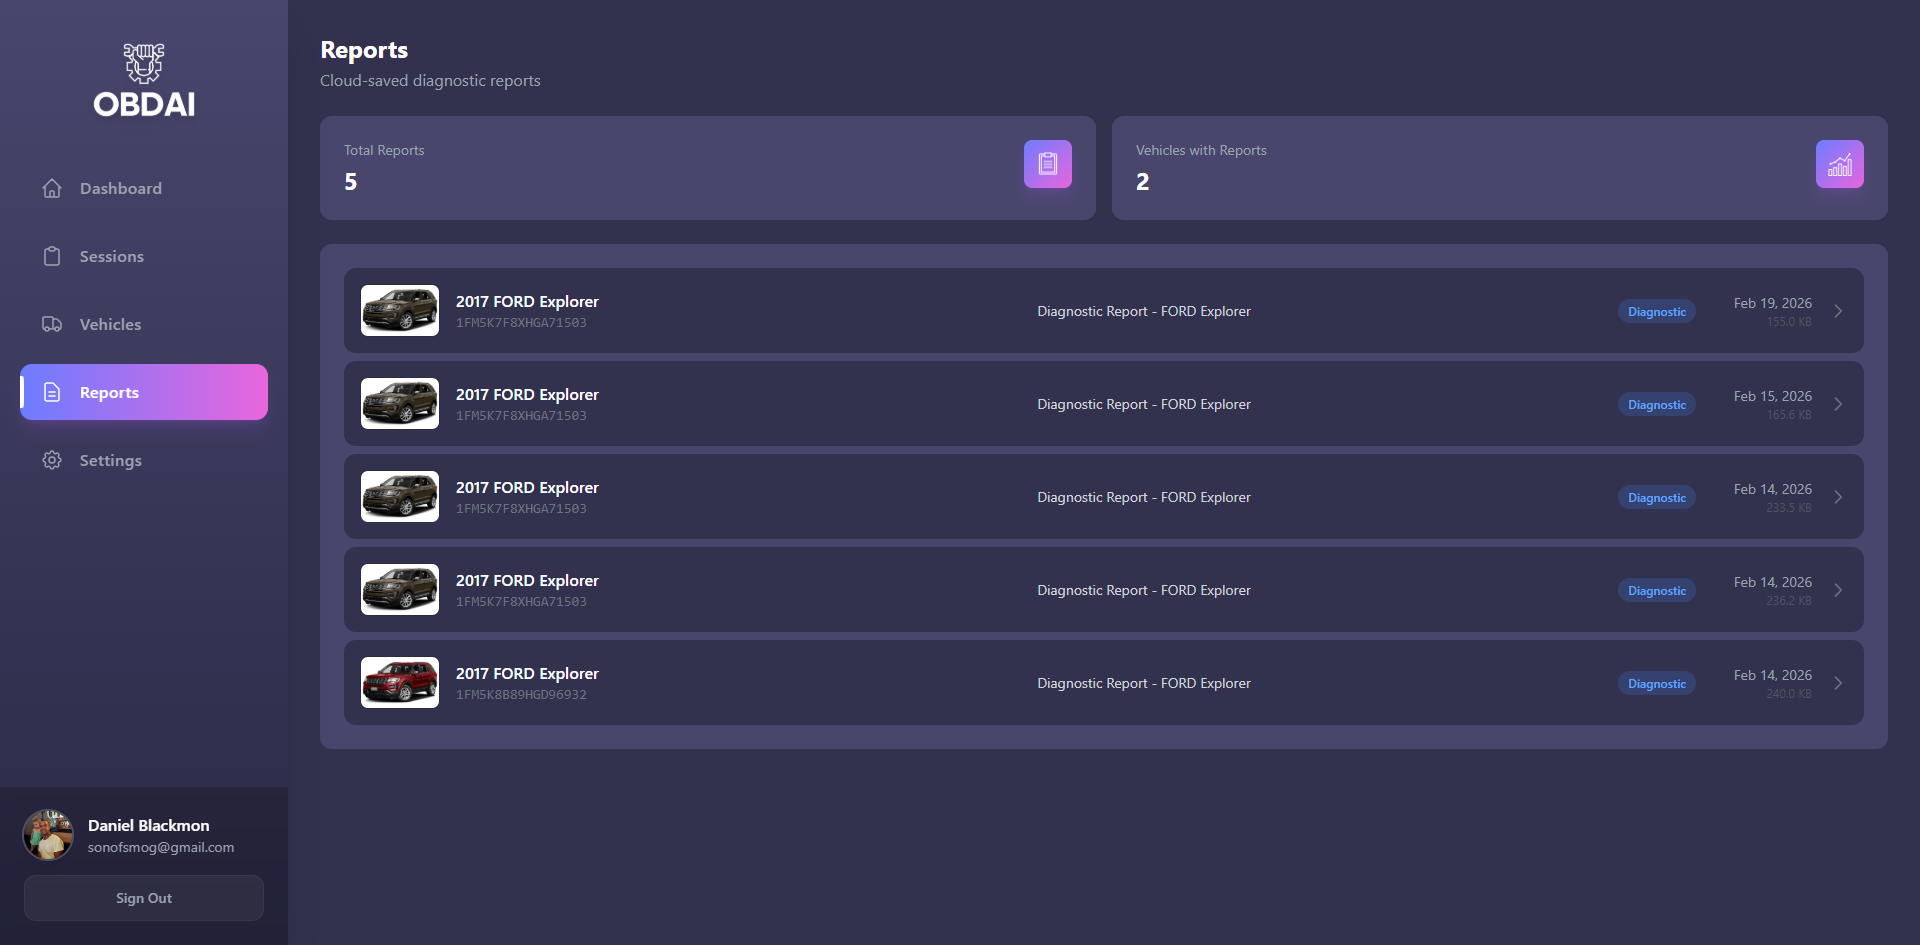
Reports
Stats: Total Reports, Vehicles with Reports.
Each saved report shows: vehicle image, vehicle name + VIN, report title, type badge (Emissions green, Diagnostic blue, Pre-Purchase orange, Estimate purple), date, and file size.
Click a report to open the Report Viewer. No reports yet? You’ll see “No reports yet” with a link to View Vehicles.
Report Viewer: Report title, Download button, Print button, and the PDF rendered inline.
 Saved reports with type badges and file sizes
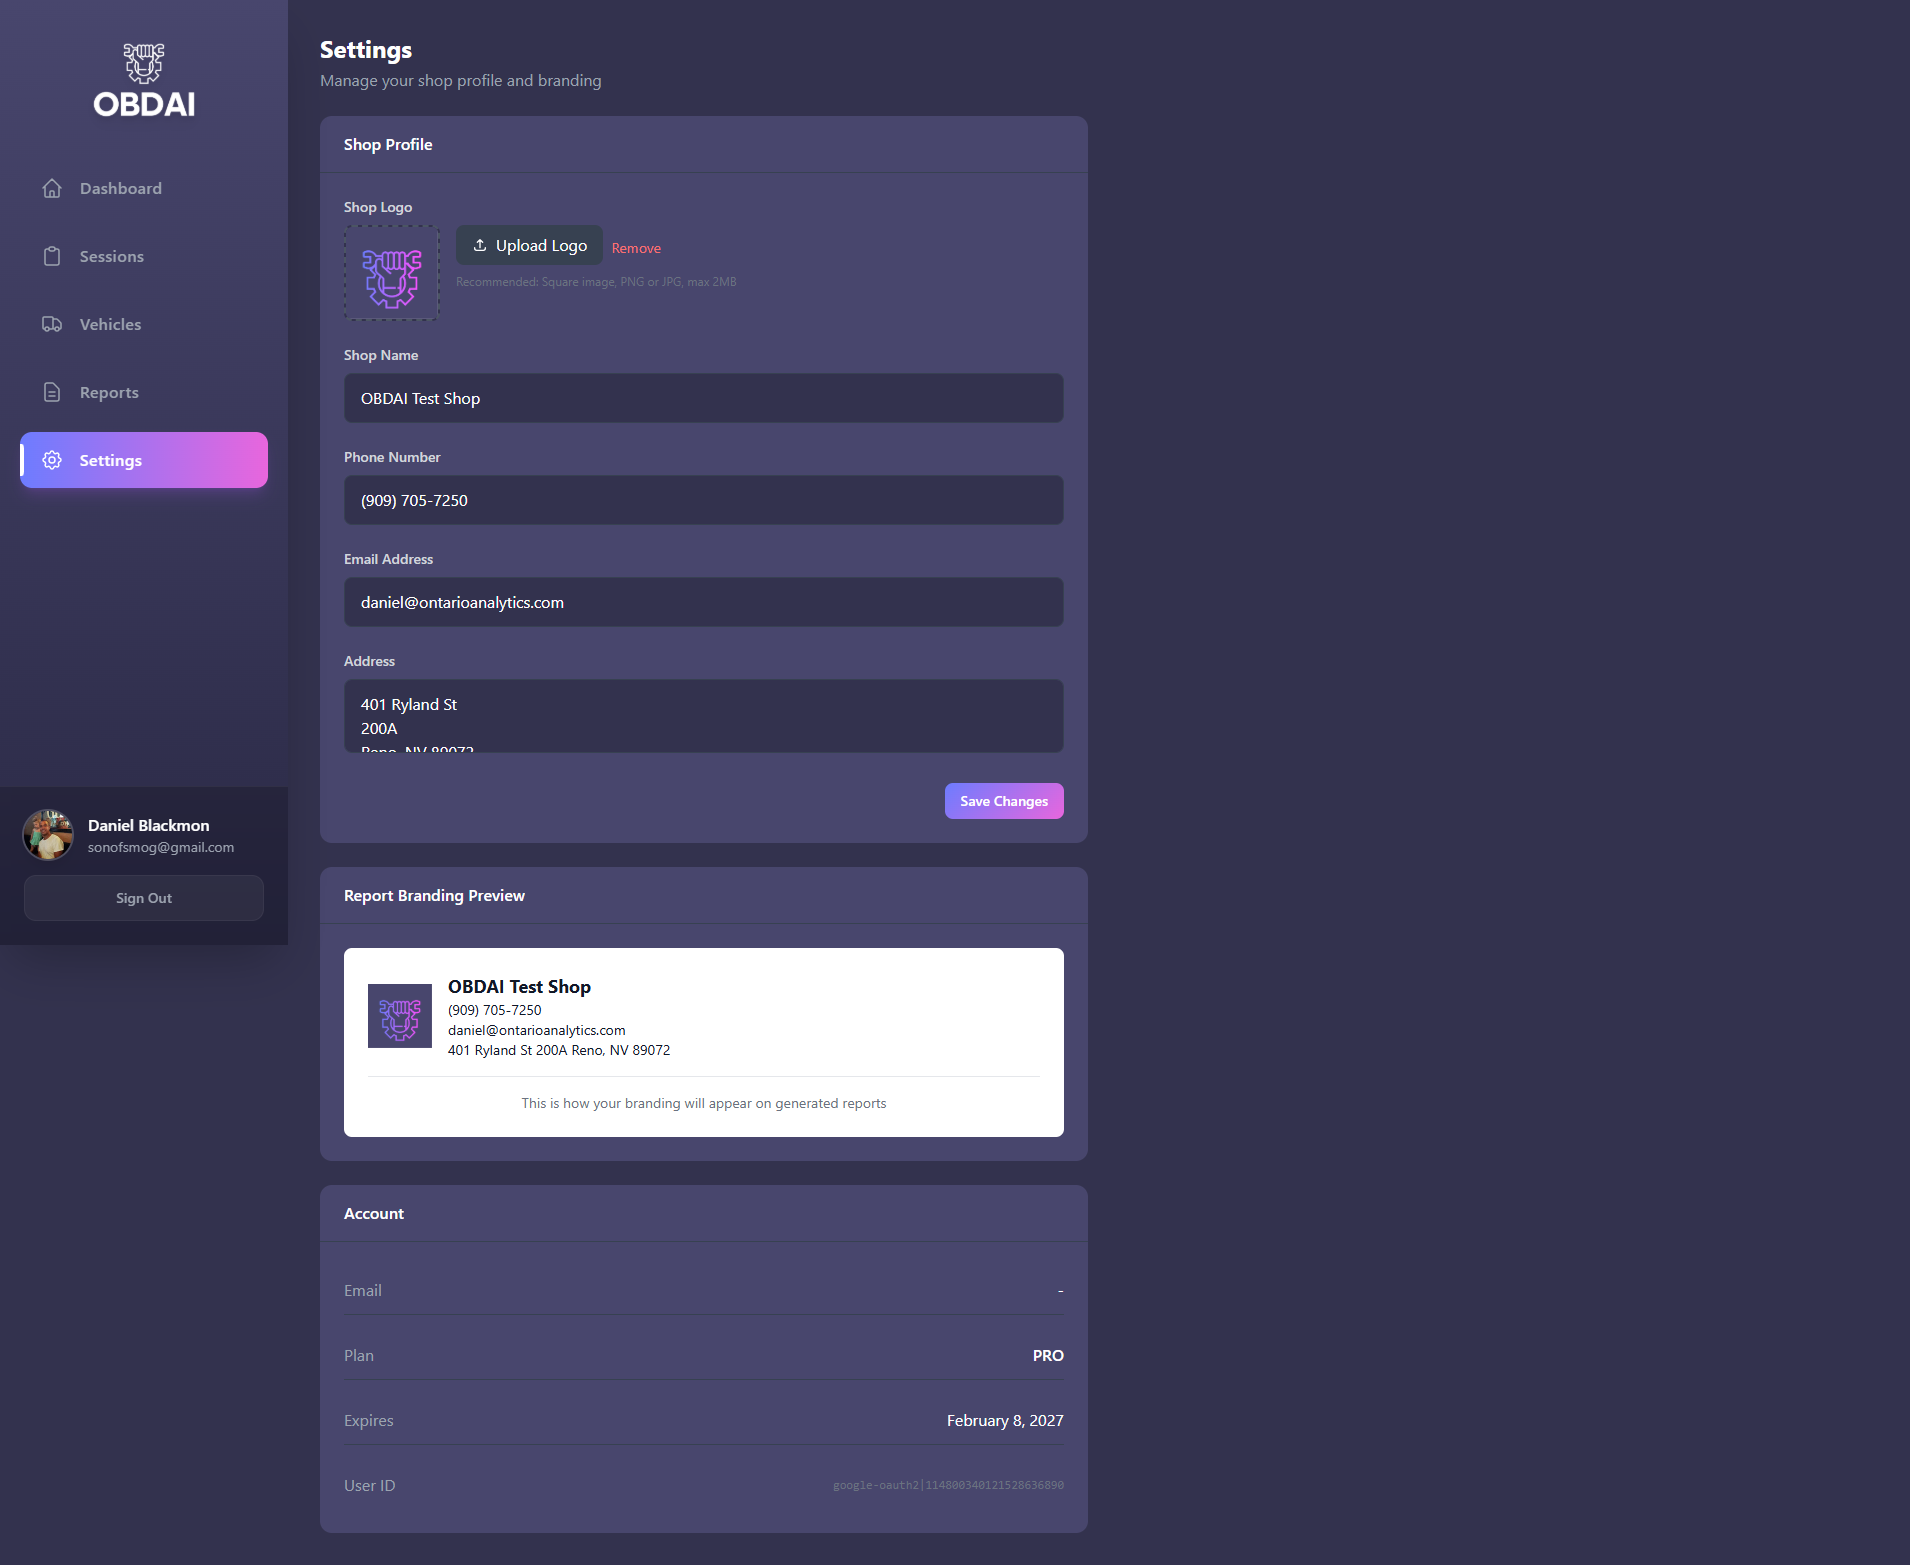
Settings
Shop Profile form:
- Shop Logo: 96×96 preview box with dashed border, accepts images up to 2MB. Recommended: square image, PNG or JPG.
- Shop Name
- Phone Number
- Email Address
- Address (textarea)
Report Branding Preview: White card showing your logo (64×64) or a “Logo” placeholder, shop name, phone, email, and address. This is what appears on your finalized PDF reports.
Account section: Your email, plan name (e.g. “PRO”), expiration date, and User ID.
 Shop profile form and branding preview
Video Walkthrough
See the dashboard in action:
OBDAI Tutorial Part 2: Web Dashboard & Custom Reports — Full walkthrough of navigation, session data, report generation, and PRO features.
Questions? support@obdai.app